dabhand.sourceforge.net software
The only software that's here currently, is stuff which I've written to get the device working for study purposes. This is for experienced developers to use, mainly because it's currently no use to end users.
Important point to note: All of the analysis utilities here contain sampling parameters that I've made up given my very limited understanding of what the hardware is producing.
All of this is in CVS, check out the dabhand module if you want to have a play. Let me show you what I've got...
dabmate-detect.C
This scans the USB bus for the DABmate module, and dumps out a few parameters. e.g.
DABmate found.
Manufacturer: dabMate
Product: USB Digital Receiver
Serial no.: 0001-80000000
Device has 3 settings.
Green LED should flash for 5 seconds.
Done.
dabmate-bulkread.C
This configures the DABmate to a particular frequency, and reads the captured signal using USB BULK READ requests. e.g.
./dabmate-bulkread 5d 02 > DUMP.bbc
It runs forever, so you'll want to interrupt it after 10 seconds or so, otherwise your disk will fill. At the moment, the captured data isn't likely to be any use to you. It can be fed to the analysis programs below.
Note: I suspect this method of reading data to be lossy. The dabmate-iso approach uses isochronous transfers, and seems to read more data.
Here's a table of frequncies which I've derived from a USB analyser.
| Band | Frequency / kHz | Value |
|---|---|---|
| 5a | 174928 | d4 d0 |
| 5b | 176640 | 80 d2 |
| 5c | 178352 | 2c d4 |
| 5d | 180064 | d8 d5 |
| 6a | 181936 | ac d7 |
| 6b | 183648 | 58 d9 |
| 6c | 185360 | 0d db |
| 6d | 187072 | ?? ?? |
| 7a | 188928 | ac d7 |
| 7b | 190640 | 58 d9 |
| 7c | 192352 | 0d db |
| 7d | 194064 | 80 de |
| Band | Frequency / kHz | Value |
|---|---|---|
| 8a | 195936 | 2c e0 |
| 8b | 197648 | 84 e3 |
| 8c | 199360 | 58 e5 |
| 8d | 201072 | 04 e7 |
| 9a | 202928 | b0 e8 |
| 9b | 204640 | 5c ea |
| 9c | 206352 | 2c ec |
| 9d | 208064 | d8 ed |
| 10a | 209936 | 04 f3 |
| 10b | 211648 | b0 f4 |
| 10c | 213360 | 5c f6 |
| 10d | 215072 | 08 f8 |
| 10n | 210096 | 2c f3 |
| Band | Frequency / kHz | Value |
|---|---|---|
| 11a | 216928 | d8 f9 |
| 11b | 218640 | 84 fb |
| 11c | 220352 | 30 fd |
| 11d | 222064 | dc fe |
| 11n | 217088 | 00 fa |
| 12a | 223936 | b1 00? |
| 12b | 225648 | 5d 02? |
| 12c | 227630 | 09 04? |
| 12d | 229072 | ?? ?? |
| 12n | 224096 | d9 00 |
| 13a | 230784 | 61 07 |
| 13b | 242496 | 0d 09 |
| 13c | 234208 | b9 0a |
| 13d | 235776 | 41 0c |
| 13e | 237488 | ed 0d |
| 13f | 239200 | 99 0f |
dabmate-iso.C
Very similar to dabmate-bulkread, this configures the DABmate to a particular frequency, and reads the captured signal using USB isochronous transfers. e.g.
./dabmate-iso 5d 02 > DUMP.bbc
It runs forever, so you'll want to interrupt it after 10 seconds or so, otherwise your disk will fill. At the moment, the captured data isn't likely to be any use to you. It can be fed to the analysis programs below.
This utility reads more data than dabmate-bulkread, so I suspect this to be a more reliable way to read the data. The iso transfer method lends itself to better support for realtime capture devices such as this, so it's not too much of a surprise.
dabmate-iso.C uses some very bodged code to support the ISO transfers, so you may have more trouble getting it to compile on your system. The problem here is that I'm using libusb, which doesn't support ISO transfers, yet.
freq-plot.py
This is a Python script, and you run it with one argument, a dump file, as captured by dabmate-bulkread above. e.g.
./dabmate-bulkread DUMP.bbc
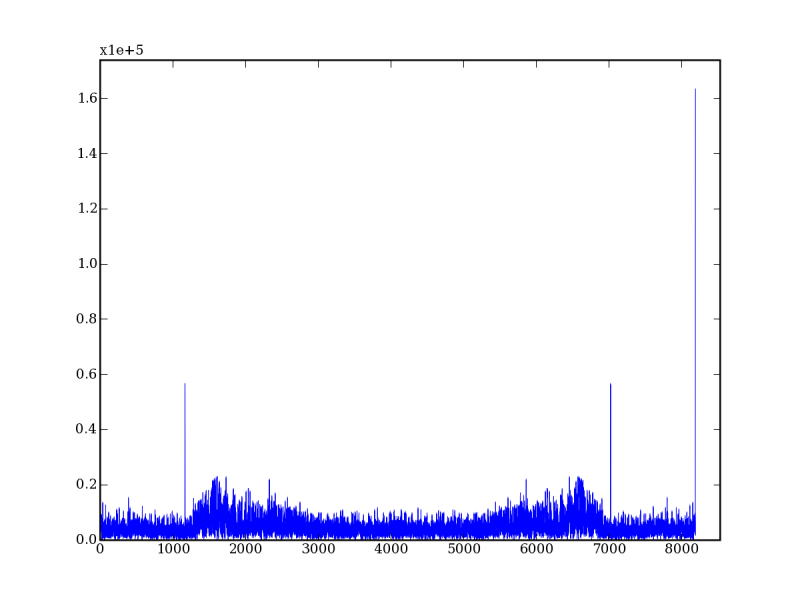
This script runs a Fourier transform on a snapshot of data from the capture file, and draw a plot on the screen like this:

The plot above is made from a real capture of a good DAB signal. The line which stands out at x=1169 is of interest. Closer analysis shows that this is likely to be the DAB central frequency. The DAB OFDM scheme does not transmit data on the central carrier, which causes it to stand out.
phase-plot.py
This is a Python script, and you run it with one argument, a dump file, as captured by dabmate-bulkread above.
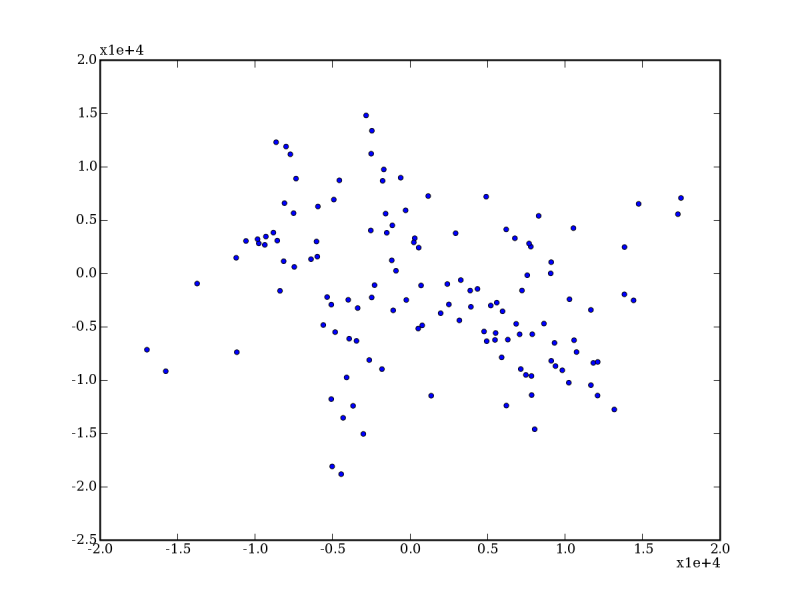
This script runs Fourier analysis over a small period of time on the data, and plots a particular value of the frequency domain (x=real, y=complex). In other words, the distance from the centre (0,0) represents the amplitude of the signal, the angle around the centre represents the phase. e.g.

The plot above is made from a real capture of a good DAB signal. Since the signal is COFDM, each carrier is moduled using QAM. So, I'd expect to see four clumps of data in the scattergram. Unfortunately, that's not what I'm seeing at the moment.
single-frequency.py
This is a Python script, and you run it with one argument, a dump file, as captured by dabmate-bulkread above.
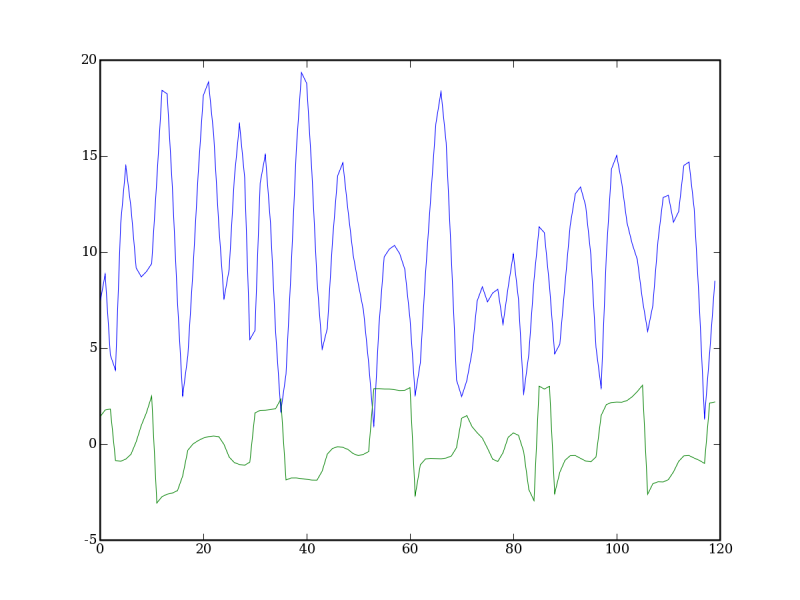
This script runs Fourier analysis over a small period of time on the data, and plots two values on the Y-axis against time on the X-axis. The two values plotted are the amplitude and phase of a particular value of the frequency domain.

The plot above is made from a real capture of a good DAB signal. The blue line is amplitude, and the green line is phase. I'd expect the blue line to be much squarer. The phase line should be closer to one of four phases, so I'd expect it to have much clearer transitions between four discrete values. The above plot has some structure but seems to have a strong random flavour.
ofdm-analyse.C
This needs the FFTW3 library, available at www.fftw.org.
This compiles to an executable which reads the standard input for data, a dump file, as captured by dabmate-bulkread above. e.g.
./ofdm-analyse < DUMP.bbc
This script runs Fourier analysis on regular time intervals of the dump data, and dumps out the value of the symbols at a range of frequencies (1165-1179) represented in ASCII on the standard output. Each value is represented as a string of up to 5 characters. The number of characters represents the amplitude, and the characters will be A, B, C or D depending on the phase quadrant each symbol appears in. Here's a snapshot of output:
    1058:DDDD  CCC   AA    AAAAA AAAAA BBBBB AAAA  BBBB  CCCC  CCCCC AAAA  BBB   AAA   AAAA  AAAA
    1059:CCC   CCC   AA    AAAAA AAAAA AAAAA AAAA  BBBB  CCCC  CCCCC CCCC  BBB   AAAA  AAAA  AAAA
    1060:CCC   CCC   AAA   BBBBB AAAAA AAAAA AAA   BBBB  AAAAA CCCCC DDDDD BBBB  AAAAA AAA   AAAAA
    1061:CCC   DDD   AAA   BBBBB AAAAA CCCCC DD    BBB   AAAAA CCCCC DDDDD BBBB  AAAAA DDD   BBBBB
    1062:CCC   DDD   AAA   DDDDD AAAAA CCCCC BBB   BBB   AAAAA CCCCC DDDDD DDDD  AAAAA DDDD  BBBBB
    1063:AAA   DDD   AAA   DDDDD AAAAA DDDDD AAA   BBB   BBB   CCCCC BBBBB DDDD  AAAAA DDDD  BBBB
    1064:AAA   BBB   AAA   CCCCC AAAAA DDDDD AAA   BBB   DDD   CCCCC BBBBB DDDD  AAAAA DDD   BBBB
    1065:AAAA  BBB   BBBB  CCCCC AAAAA BBBBB AA    BBB   DDDD  CCCCC AAAAA CCCC  AAAAA BBB   BBBB
    1066:AAAA  BBBB  BBBB  AAAAA BBBBB BBBBB BBB   BBB   CCCC  CCCCC AAAA  CCCC  AAAAA AAAA  BBBB
    1067:AAA   BBBB  BBB   BBBBB BBBBB BBBBB BBB   BBB   CCCC  CCCCC CCCCC AAA   AAAAA AAAA  BBBB
    1068:CCC   BBBB  AAA   BBBBB BBBBB AAAAA CC    BBB   AAAAA CCCCC CCCC  AAA   AAAAA CCCC  DDDD
    1069:CCC   BBBB  AAA   DDDDD BBBBB AAAAA CCC   BBBB  AAAA  CCCCC DDDD  BBB   AAAAA CCCCC DDDD
    1070:DDDDD BBBB  CCC   DDDDD BBBBB CCCCC CCC   BBBBB AAA   CCCCC DDDD  DDD   AAAAA CCCCC DDDD
    1071:DDDDD BBBB  CCC   CCCCC BBBBB CCCCC CCCC  BBBBB DDDD  CCCCC BBBB  DDD   AAAAA CCCC  DDD
    1072:DDDDD AAA   CCC   CCCCC BBBBB DDDDD AAAAA BBBBB DDDDD CCCCC BBBBB DDD   AAAA  DDDD  D
    1073:DDD   AAA   AA    AAAAA BBBBB DDDDD AAAAA BBBBB DDDDD CCCCC AAAAA CCC   AAA   DDD   A
    1074:BBB   AAA   AAA   AAAAA BBBBB BBBBB AAAA  BBBBB DDD   CCCCC AAAAA CCC   AA    DDD   DD
    1075:BBB   AAAA  AAAA  BBBBB BBBBB BBBBB AAAAA BBBBB AAAA  AAAAA CCCCC CCCC  CC    DDD   DDD
    1076:BBB   AAAA  AAAAA DDDDD BBBBB BBBBB AAAAA AAAA  AAAAA AAAAA CCCCC CCCC  DDD   DD    DDD
    1077:BBB   AAAA  AAAA  DDDDD BBBBB AAAAA BBBBB AAA   BBBBB AAAAA CCCCC CCCC  DDD   C     DDD
    1078:BBB   BBBB  CCCC  CCCCC BBBBB AAAAA BBBB  CCC   BBBBB AAAAA CCCC  CCC   DDD   CCC   DDD
    1079:AAA   BBBB  CCCC  CCCCC BBBBB CCCCC BBBBB CCCC  BBBBB AAAAA BBB   DDD   DDD   CCC   DDD
    1080:AAAA  BBB   CCC   AAAAA BBBBB CCCCC BBBB  CCCC  DDDD  CCCCC BBBB  BBB   DDD   CCC   DD
    1081:AAAA  BBB   DDD   AAAAA BBBBB DDDDD BBB   DDD   CCC   CCCCC AAAAA BBB   DDDD  CCC   AAA
    1082:CCCC        DDD   BBBBB BBBBB DDDDD DDD   DDD   CCCC  AAAAA AAAAA BBBB  DDDD  BB    AAAA
    1083:CCC   CCC   CCC   BBBBB BBBBB BBBBB DDD   DDD   AAAA  AAAAA CCCCC DDDD  DDDDD BBBB  AAAA
    1084:AAA   CCCC  DDD   DDDDD BBBBB BBBBB BBB   DDD   BBBBB AAAAA CCCCC DDDDD BBBBB BBBB  AAAA
    1085:AAA   CCCC  DDD   CCCCC DDDDD BBBBB B     CCC   BBBBB AAAAA CCCCC CCCCC BBBBB AAAA  BBBB
    1086:AAA   CCCC  DDD   CCCCC DDDDD AAAAA DDD   CCCC  BBBBB AAAAA DDDDD CCCCC BBBBB AAAAA BBBB
    1087:AAA   CCC   BBBB  AAAAA DDDDD AAAAA BBBBB CCCCC BBBBB AAAAA DDDDD CCCCC BBBBB AAAA  BBBBB
    1088:AA    AAA   BBBB  AAAAA DDDDD CCCCC BBBBB CCCCC DDDD  AAAAA BBBBB AAAAA BBBBB AAA   DDDDD
    1089:CC    AAA   DDDD  BBBBB DDDDD CCCCC BBBBB CCCCC CCCCC AAAAA BBBBB AAAAA BBBBB BBBB  DDDDD
    1090:C     AAA   DDD   BBBBB DDDDD DDDDD BBBB  DDDD  CCCCC AAAAA AAAA  AAAA  BBBBB BBBBB DDDDD
    1091:BBB   AAA   DDD   DDDDD DDDDD DDDDD DDD   DDDD  AAAA  AAAAA AAAA  BBBB  BBBBB BBBBB DDDD
    1092:BBBB  CCC   DDD   DDDDD DDDDD BBBBB AAA   DDDDD BBBBB AAAAA CCCC  BBBB  BBBBB BBBBB DDD
    1093:BBBB  CCCC  DDDD  CCCCC DDDDD BBBBB AAAAA DDDDD BBBBB AAAAA CCCCC BBB   BBBB  BBBBB CCC
    1094:BBBB  CCCC  DDDD  AAAAA DDDDD BBBBB AAAAA DDDDD BBBBB AAAAA DDDDD AAAA  DDDD  BBBB  CCCC
    1095:BBB   CCCC  DDDD  AAAAA DDDDD AAAAA AAA   DDDDD DDDDD AAAAA DDDDD AAAAA DDDD  BBB   CCCCC
    1096:DDD   CCCC  DDD   BBBBB DDDDD AAAAA BBB   DDDDD DDDDD AAAAA DDDDD AAAAA BBBB  DDDD  CCCCC
    1097:DDD   CCC   DDD   BBBBB DDDDD CCCCC BBBB  DDDDD CCCCC AAAAA BBB   AAAA  BBBBB DDDD  CCCCC
    1098:BB    CCC   CCC   DDDDD DDDDD CCCCC DDDD  DDDDD CCCCC AAAAA AAAA  AAA   BBBBB DDDDD CCCC
The columns represent the values of frequencies, and the rows represent time-incremental samples. The frequency range was chosen as it contains the frequency shown in the FFT plot from freq-plot.py. There's a strong pattern here, although I was hoping to see the frequency carrying a static pattern, rather than one which rotates.
If you live in a place where there is VERY strong DAB reception, I'd be interested in the results you get.